
Visualization is one of the keys to exploring the world of complex inter-connected problems and opportunities.Other media such as video and photography, music and dance, art and design, each have a role to play. But graphic visualization is an easy place to start in discussion, and easy to fit alongside text content.
Conversations and dialogues, as with Plato in the 4th century BC, are the key to exploring complex inter-connected problems and opportunities. The ‘visual conversations’ here are ongoing experiments, from 2 decades of drawing: scenarios and visions, complex problems, dreams and aspirations.

A visual conversation should bring to the surface things which might be difficult or risky to say or write – e.g. this from the ‘Future of Greater Manchester’ project…

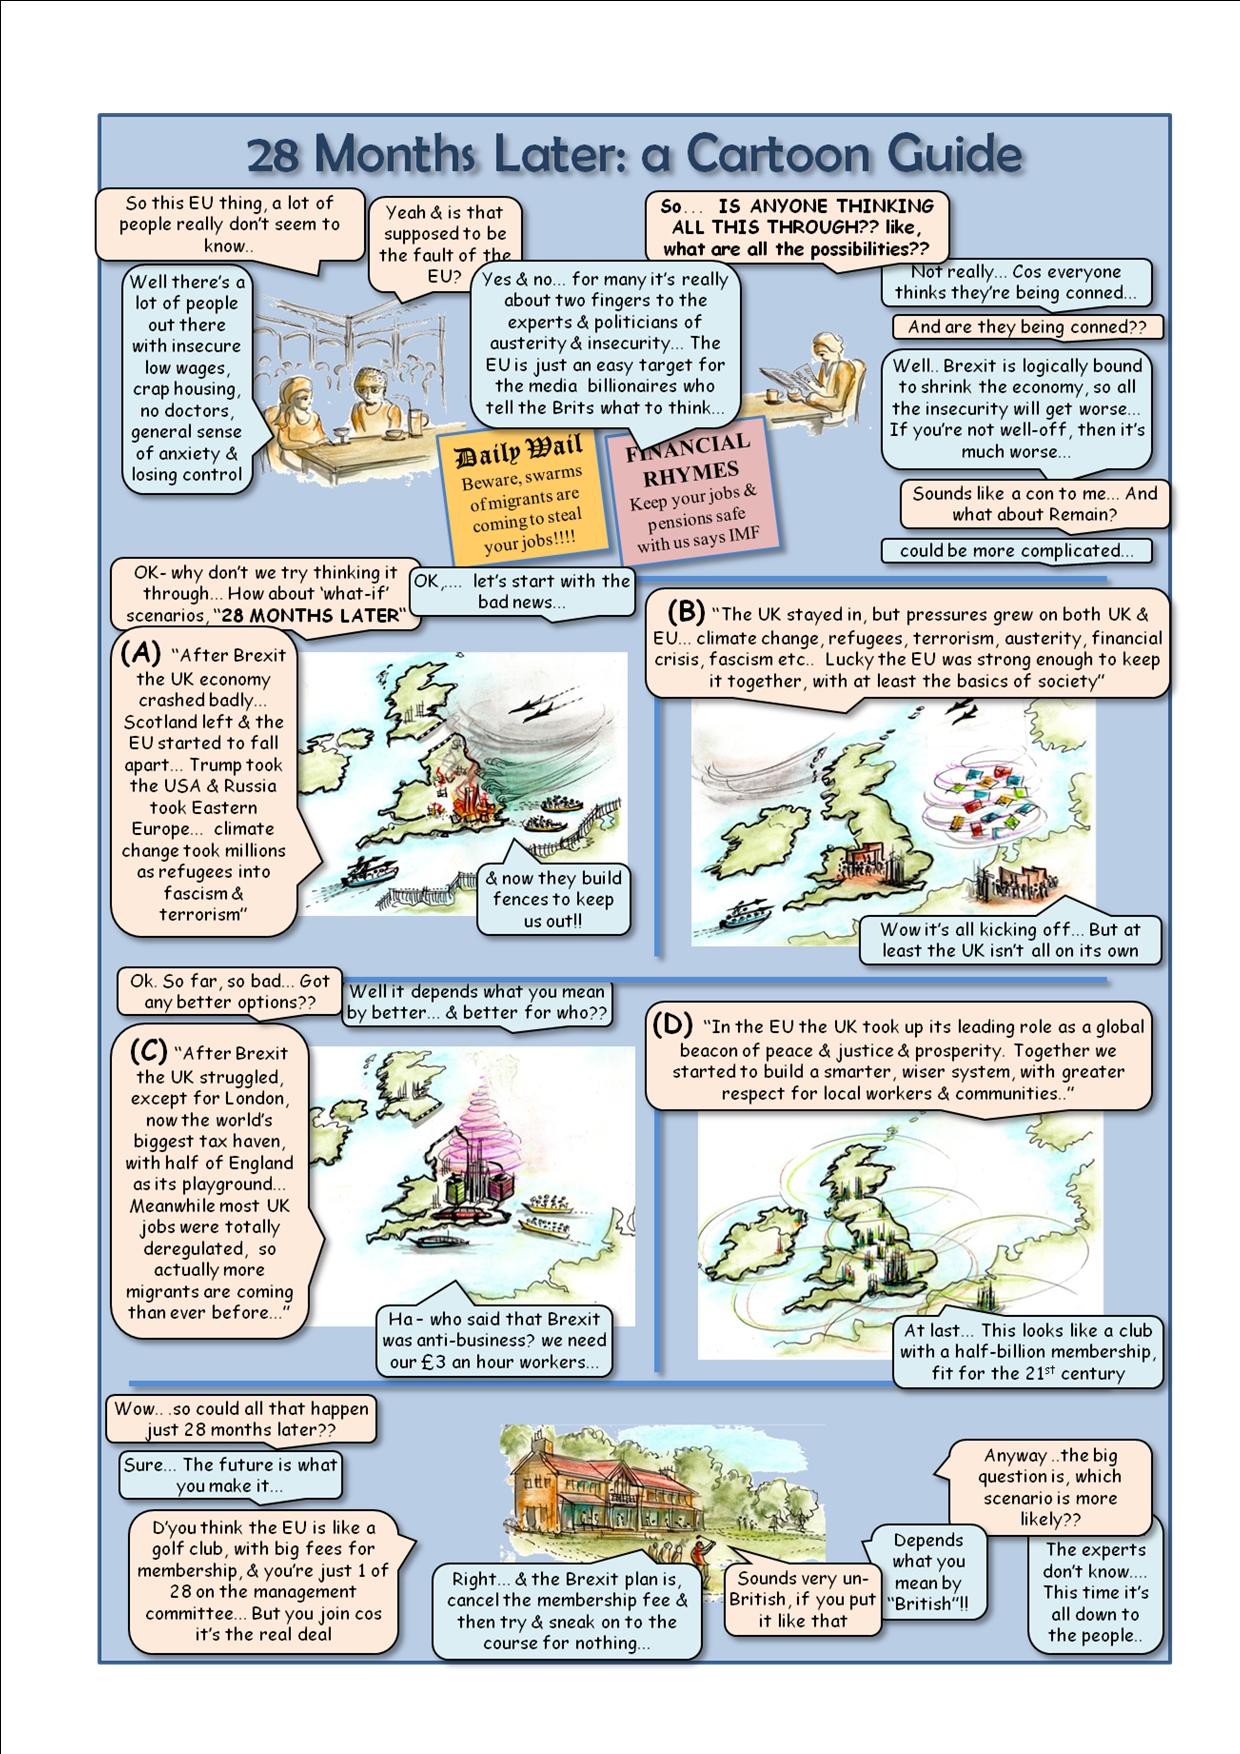
BIGGER PICTURE – EXPLORING THE BREXIT
Our whole future here is at stake – so we asked ourselves (before and after), is anyone thinking all this through?? what are all the possibilities and probabilities?? Where are the future studies, strategy analysis, or foresight techniques? We tried some DIY foresight at various points to ‘think it through’. Anyway, the big question is, which scenario is more likely?? The experts can’t say …. This time it’s all down to the people…
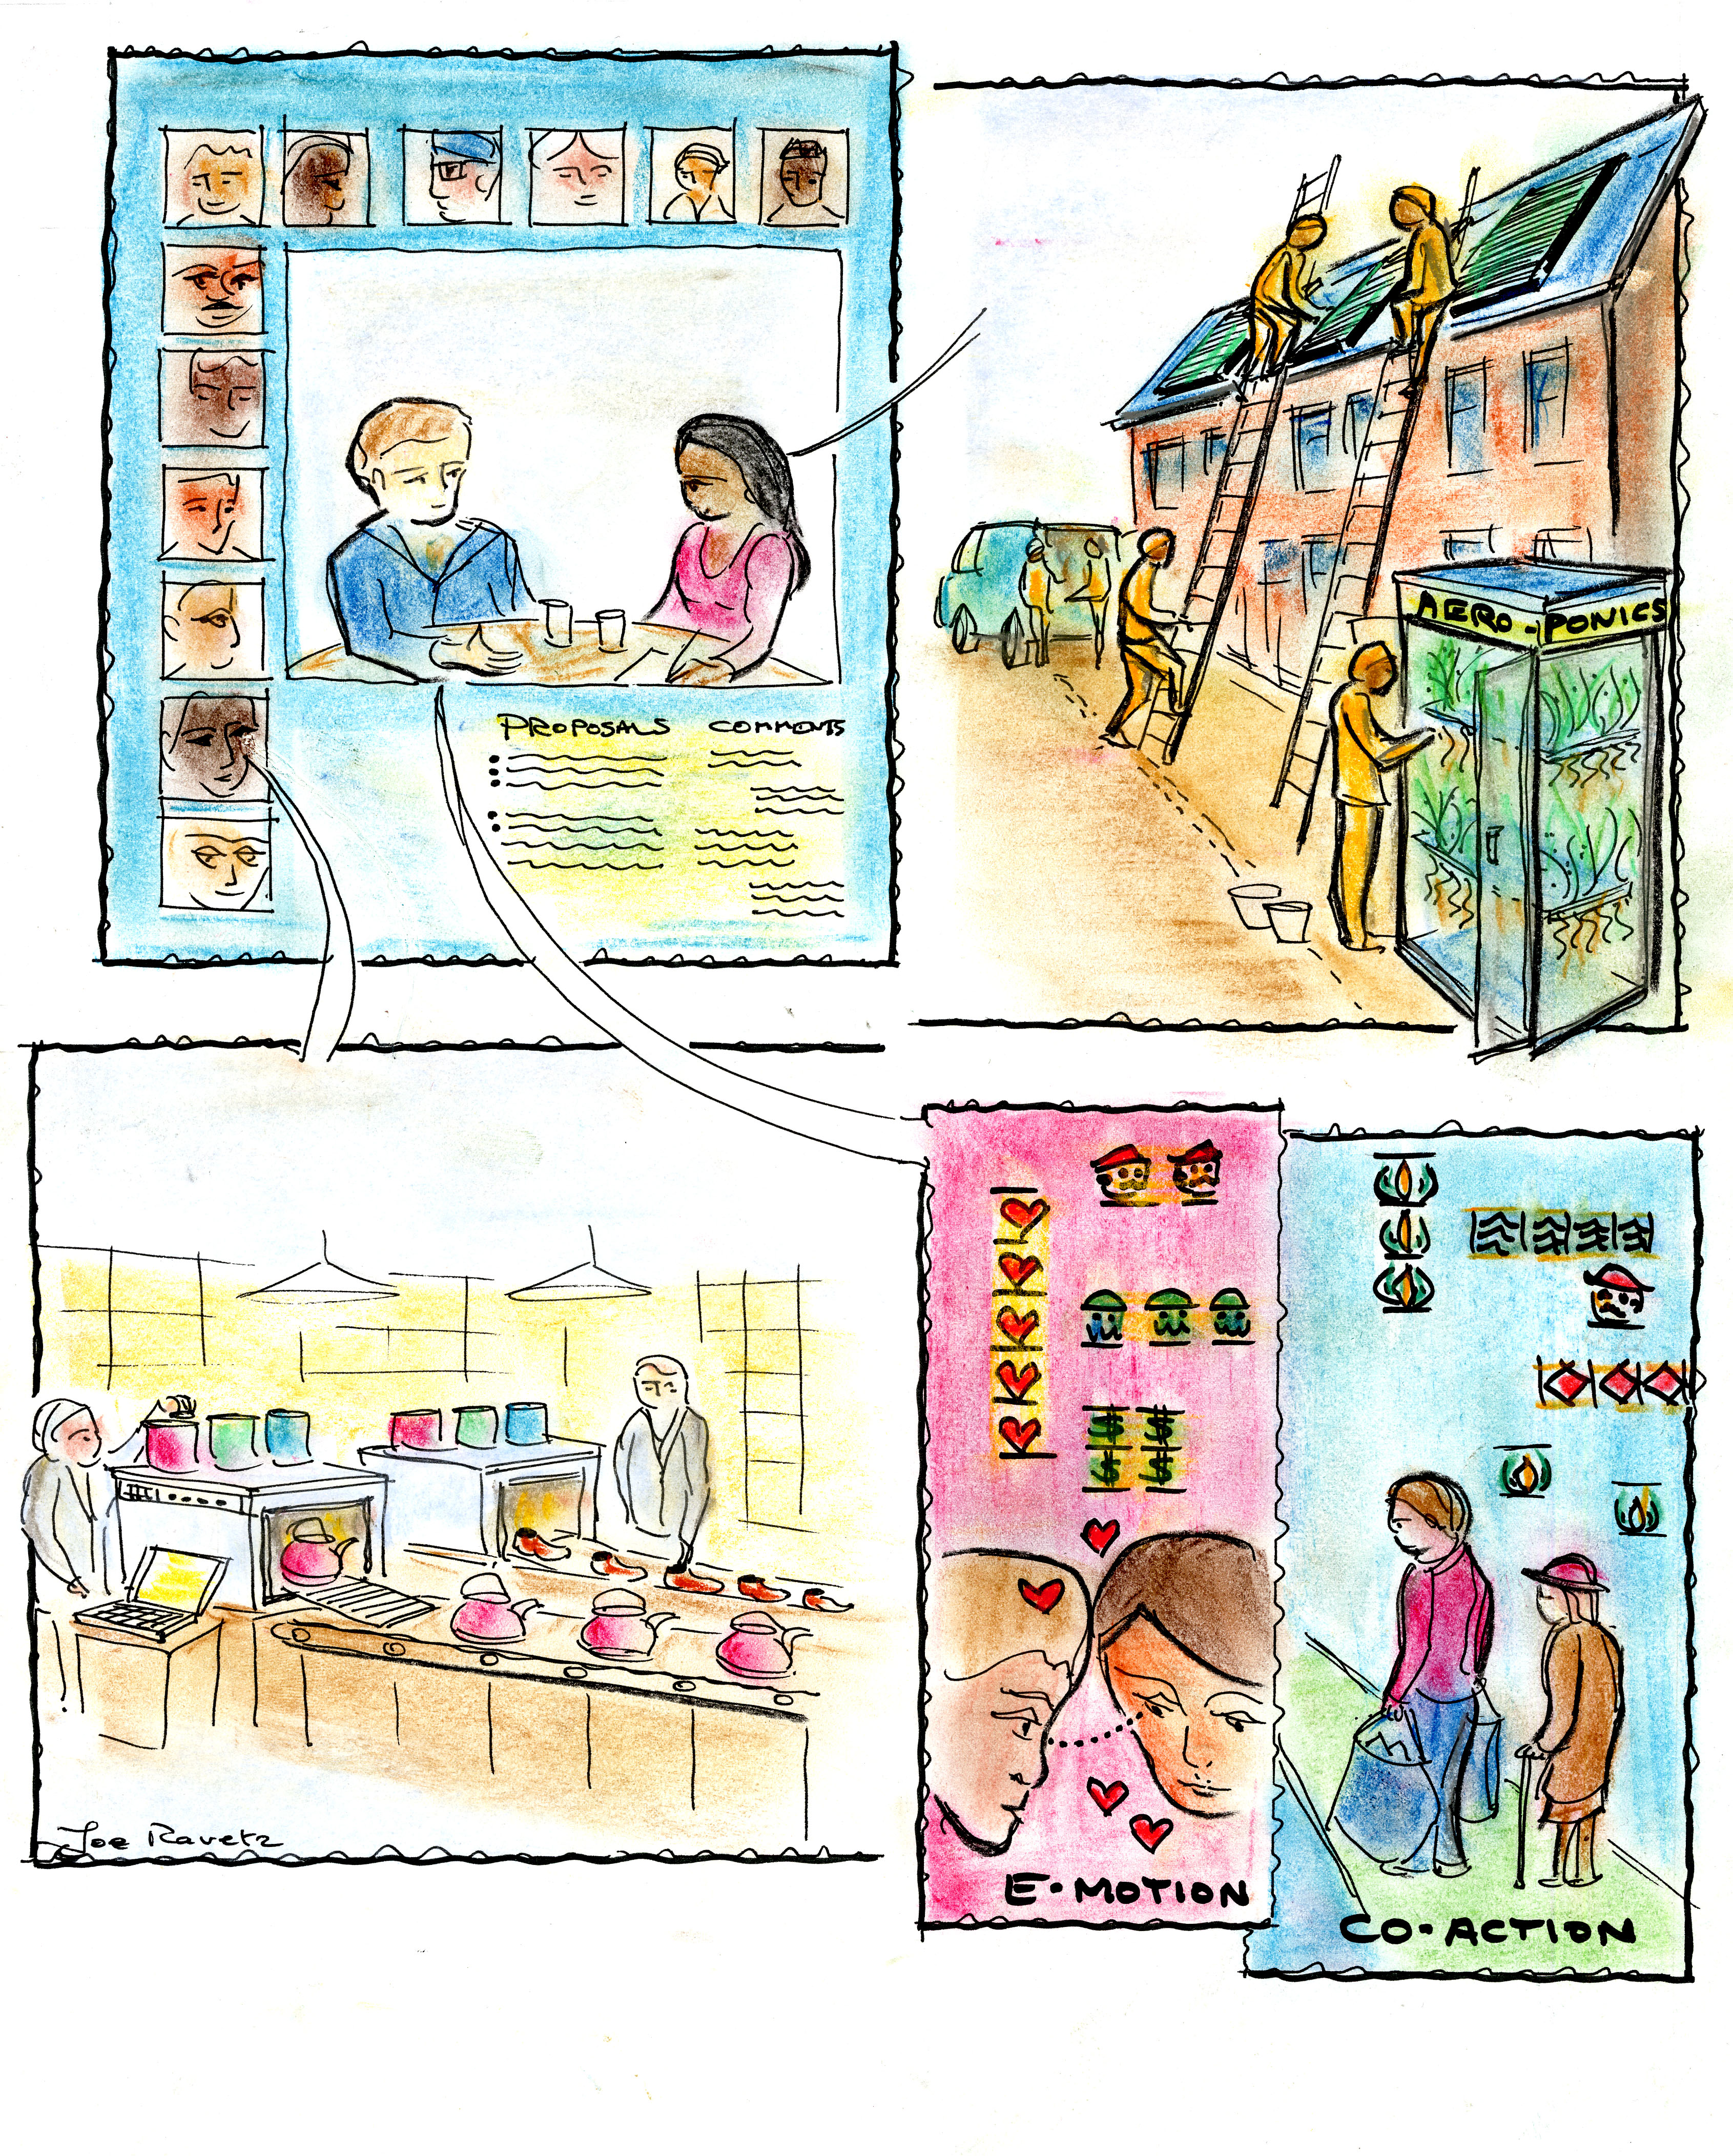
VISUAL THINKING & STORYLINES
Here are some examples of visual storylines, – as presented to the conference Facing Extinction at the University of Creative Arts, June 2014 (extracts from the epilogue of Urban 3.0).
facing extinction – ravetz – 07-06-14
These follow on the development of a workshop method and process for ‘Visual Foresight’: Briefing 5 .
This is especially useful for exploring highly inter-connected and multi-channel issues, where the normal text-based approach isn’t enough. We find that direct visual participation, i.e. getting participants to physically draw, or visualize their thinking directly via a facilitator, enables them to think ‘outside the box’, find new patterns and develop creative ideas. The material can then be completed for publication, which can inspire readers to also think outside the box.
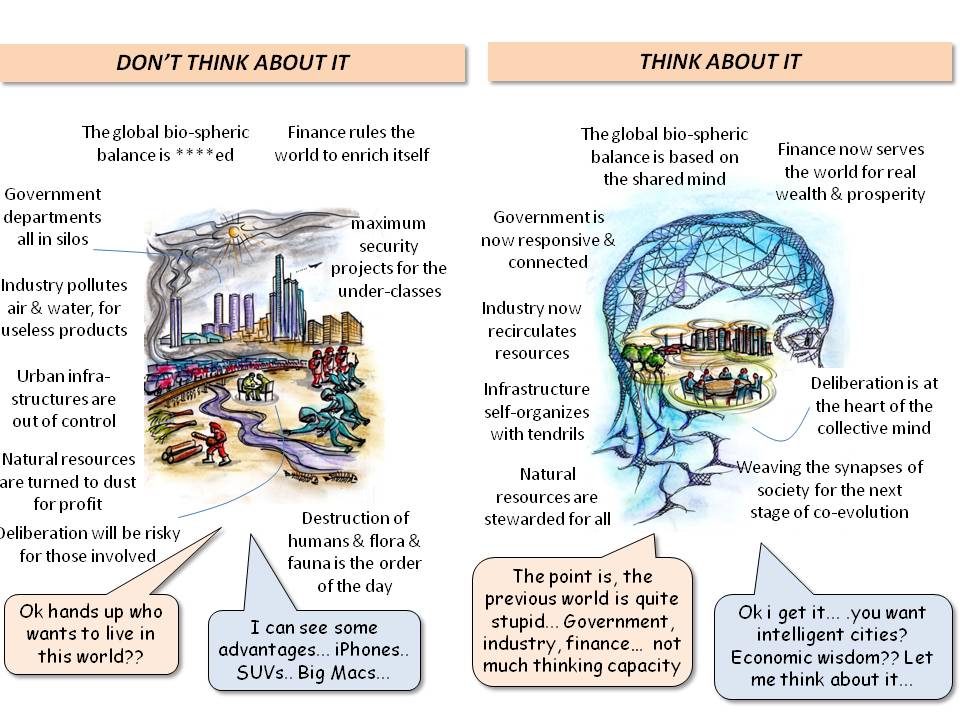
We also find that visualization is essential where people are dealing with highly abstract concepts. The current debates on ‘Grand Challenges’ and ‘Global Nexus’ is welcome, but also brings a typical ‘goldfish bowl’ of expert science-policy sophistication. So, visualization for research foresight, science / innovation policy, technology / policy analysis, etc, looks for ways out of this technocratic bowl into a wider landscape…

A quite unsorted pile of studio samples and materials can be found on – http://www.flickr.com/photos/joe-ravetz-visions/albums
VISUAL FORESIGHT & GRAPHIC FACILITATION SERVICES
Joe Ravetz is an experienced futurist & graphic facilitator, and a keen advocate of visualization for democratic debate. He has worked with organizations such as EU – DG Research, the Institute for Alternative Futures, Rockefeller Foundation, Institute for Innovation Research, South East England Development Agency, and the ESRC (UK Economic and Social Research Council).
Various reports with examples of visualization can be found on
- http://www.altfutures.org/vulnerability2030
- http://www.rockefellerfoundation.org/blog/foresight-smart-globalization
- https://osha.europa.eu/en/topics/green-jobs
VISUAL FORESIGHT AS A PROCESS
‘Graphic facilitation’ is now established as a valuable technique in process workshops, with a London institute and active network of practitioners (www.vizthink.co.uk ) . Independently the concept of ‘relational visualization’ arose from a 10-year programme of strategy and futures workshop processes, where visual material produced on site or off site was often a powerful stimulus and catalyst to creative group thinking. By extension, the visual material then became more embedded in the process itself (see examples at Ravetz, 2009c). There are broadly two strands in this:
- In the first strand is visualization AS a process – i.e. used in workshop or discussion situations – visioning, consensus building, conflict mediation, strategy forming, negotiation and bargaining.
- In the second strand is the visualization OF a process – i.e. directly capturing dialogue, debate, argument and even conflict. The classic cartoon strip is one example where a dialogue can communicate a pattern of thinking which is hardly possible in any other way.
We have found that a series of steps can be achieved in small groups, approximately following the ‘relational mapping’ cycle above, depending on the balance of process facilitation and graphic facilitation:
- Visualize a problem or ‘agenda’, and explore its dimensions and boundaries;
- Simulate the roles of characters and forces (either by discussion, role play or direct visualization);
- Explore relationships, arguments, conflicts and other interactions; (by feeding words and dialogues into the mouths of characters on sticky notes)
- Explore alternative ways of thinking , (by overlaying and playing with the comments and dialogues). This can explore what is ‘interesting’, not only direct positives and negatives, or costs and benefits;
- Develop opportunities for added value in working together: using cartoons, flow charts and other media, look at the possibilities for increasing added value
- Visualize new synergies and solutions, based on real-time feedback. This can steer towards an interim outcome – rather than trying to ‘solve the problem’, explore what is interesting and relevant to further discussion.
Such a method is still at the prototype stage, and will continue `to learn from a great many alternative approaches in visual thinking, graphic facilitation, visioning and mediation, and so on.
Some literature:
Ravetz, J (2013): Beyond the linear: the role of visual thinking and visualization, In: O’Riordan, T and Lenton, T, (Eds): Addressing Tipping Points for a Precarious Future: Oxford University Press for the British Academy: pp289-299
Ravetz, J (2011): Exploring creative cities for sustainability with deliberative visualization: In Girard, L.F. and Nijkamp, P (Eds): Creativity and Sustainable Cities: Oxford, Heinemann

0 Comments